以綫圖錶形式呈現數據。 更多...
| import 語句: | import QtCharts 2.15 |
| 實例化: | QLineSeries |
| 繼承: |
綫圖錶用於將信息顯示成由直綫連接的一係列數據點。
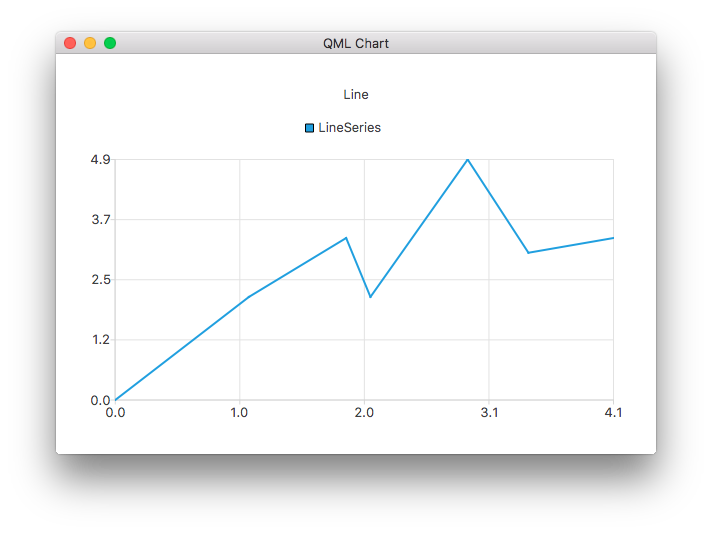
以下 QML 範例展示如何創建簡單綫圖錶:
ChartView {
    title: "Line"
    anchors.fill: parent
    antialiasing: true
    LineSeries {
        name: "LineSeries"
        XYPoint { x: 0; y: 0 }
        XYPoint { x: 1.1; y: 2.1 }
        XYPoint { x: 1.9; y: 3.3 }
        XYPoint { x: 2.1; y: 2.1 }
        XYPoint { x: 2.9; y: 4.9 }
        XYPoint { x: 3.4; y: 3.0 }
        XYPoint { x: 4.1; y: 3.3 }
    }
}
控製綫的帽蓋樣式。設為之一對於 Qt.FlatCap , Qt.SquareCap or Qt.RoundCap 。默認情況下,帽蓋樣式為 Qt.SquareCap。
另請參閱 Qt::PenCapStyle .
|
count : int |
係列的數據點數。
控製綫的樣式。設為之一對於 Qt.NoPen , Qt.SolidLine , Qt.DashLine , Qt.DotLine , Qt.DashDotLine ,或 Qt.DashDotDotLine 。使用 Qt.CustomDashLine QML API 不支持。默認情況下,樣式為 Qt.SolidLine。
另請參閱 Qt::PenStyle .
|
width : real |
綫的寬度。默認情況下,寬度為 2.0。