Qt Charts QML API 是在 QML 應用程序中,直觀且簡單展示圖錶的手段。
使用以下 QML 創建簡單餅狀圖錶:
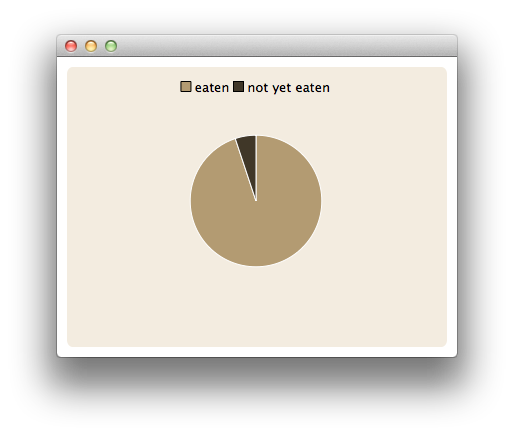
import QtQuick 2.0
import QtCharts 2.0
ChartView {
    width: 400
    height: 300
    theme: ChartView.ChartThemeBrownSand
    antialiasing: true
    PieSeries {
        id: pieSeries
        PieSlice { label: "eaten"; value: 94.9 }
        PieSlice { label: "not yet eaten"; value: 5.1 }
    }
}
注意: 從 Qt Creator 3.0 起,采用基於 Qt Quick 2 模闆的 Qt Quick 應用程序嚮導創建的工程使用 QGuiApplication 在默認情況下。由於 Qt Charts 利用 Qt 圖形視圖框架為繪製, QApplication 必須使用。采用嚮導創建的工程可用於 Qt Charts 後於 QGuiApplication 被替換采用 QApplication .
| 用於專用軸類型的基本類型 | |
| 用於所有條形係列類型的抽象父級類型 | |
| 用於所有 Qt Chart 係列類型的基類型 | |
| 在區域圖錶中呈現數據 | |
| 將類彆添加到圖錶軸 | |
| 將一係列數據按類彆分組呈現為垂直條形 | |
| 錶示條形圖錶中的一組條形 | |
| Presents data in box-and-whiskers charts | |
| Represents one item in a box-and-whiskers chart | |
| Represents a series of data as candlesticks | |
| Represents a single candlestick item in a candlestick chart | |
| Places named ranges on the axis | |
| Defines a range on a category axis | |
| 管理圖錶的係列、圖例和軸的圖形錶示 | |
| Adds dates and times to a chart's axis | |
| Horizontal model mapper for bar series | |
| Horizontal model mapper for box plot series | |
| Horizontal model mapper for a candlestick series | |
| Horizontal model mapper for pie series | |
| A horizontal model mapper for XYSeries | |
| Presents a series of data as horizontal bars grouped by category | |
| Presents a series of categorized data as a percentage of each category | |
| Presents a series of data as stacked horizontal bars, with one bar per category | |
| 顯示圖錶的圖例 | |
| 以綫圖錶形式呈現數據 | |
| Adds a logarithmic scale to a chart's axis | |
| Defines margins between the edge of the chart rectangle and the plot area | |
| Presents a series of categorized data as a percentage of each category | |
| Presents data in pie charts | |
| Represents a single slice in a pie series | |
| Presents data in polar charts | |
| Type presents data in scatter charts | |
| 以樣條綫圖錶形式呈現數據 | |
| Presents a series of data as vertically stacked bars, with one bar per category | |
| Vertical model mapper for bar series | |
| Vertical model mapper for box plot series | |
| Vertical model mapper for a candlestick series | |
| Vertical model mapper for pie series | |
| A vertical model mapper for XYSeries | |
| 將值添加到圖錶軸 | |
| Initializes XY-series coordinate data | |
| A base type for line, spline, and scatter series |