範例展示如何創建簡單樣條綫圖錶。
要運行範例從 Qt Creator ,打開 歡迎 模式,然後選擇範例從 範例 。更多信息,拜訪 構建和運行範例 .
要創建樣條綫圖錶,需要將數據放入 QSplineSeries . QSplineSeries automatically calculates spline segment control points that are needed to properly draw the spline.
QSplineSeries *series = new QSplineSeries();
series->setName("spline");
Now let's add some data points to the series.
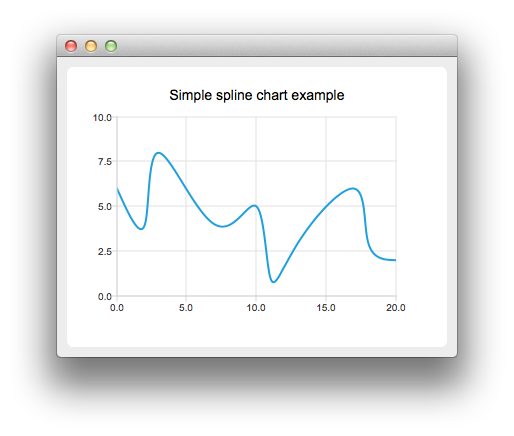
series->append(0, 6);
series->append(2, 4);
series->append(3, 8);
series->append(7, 4);
series->append(10, 5);
*series << QPointF(11, 1) << QPointF(13, 3) << QPointF(17, 6) << QPointF(18, 3) << QPointF(20, 2);
The data series has been populated. To display it on a chart we create a QChart object and add the data series to it. We also set the title and the values range on the y-axis, so that our chart's visibility is better.
QChart *chart = new QChart();
chart->legend()->hide();
chart->addSeries(series);
chart->setTitle("Simple spline chart example");
chart->createDefaultAxes();
chart->axes(Qt::Vertical).first()->setRange(0, 10);
Then we create a QChartView 對象采用 QChart as a parameter. This way we don't need to create a QGraphicsView scene ourselves. We also set the Antialiasing on to have the rendered lines look nicer.
QChartView *chartView = new QChartView(chart);
chartView->setRenderHint(QPainter::Antialiasing);
Finally, we set the QChartView as the windows's central widget.
QMainWindow window;
window.setCentralWidget(chartView);
window.resize(400, 300);
window.show();
文件: