Presents data as spline charts. 更多...
| import 語句: | import QtCharts 2.3 |
| 實例化: | QSplineSeries |
| 繼承: | XYSeries |
樣條綫係列存儲數據點和分段控製點需要通過 QPainterPath 來繪製樣條綫。會自動計算控製點,當數據改變時。算法計算點,以便可以繪製正常樣條綫。
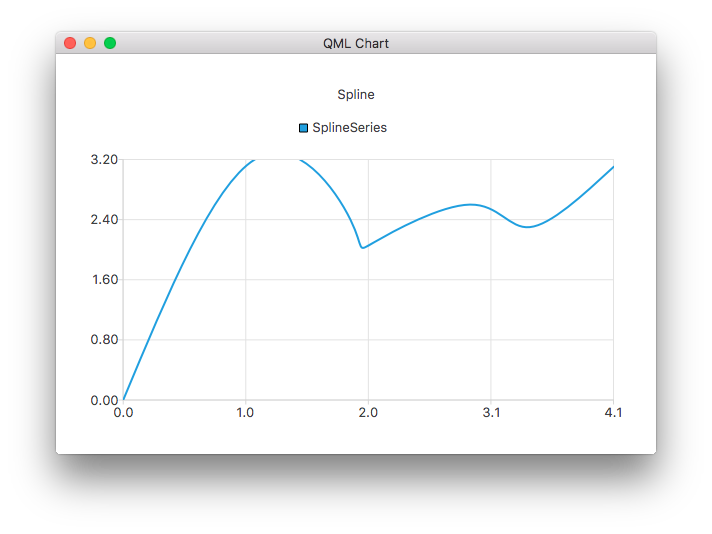
The following QML code shows how to create a simple spline chart:
ChartView {
    title: "Spline"
    anchors.fill: parent
    antialiasing: true
    SplineSeries {
        name: "SplineSeries"
        XYPoint { x: 0; y: 0.0 }
        XYPoint { x: 1.1; y: 3.2 }
        XYPoint { x: 1.9; y: 2.4 }
        XYPoint { x: 2.1; y: 2.1 }
        XYPoint { x: 2.9; y: 2.6 }
        XYPoint { x: 3.4; y: 2.3 }
        XYPoint { x: 4.1; y: 3.1 }
    }
}
控製綫的帽蓋樣式。設為之一對於 Qt.FlatCap , Qt.SquareCap or Qt.RoundCap . By default, the cap style is Qt.SquareCap.
另請參閱 Qt::PenCapStyle .
|
count : int |
係列的數據點數。
控製綫的樣式。設為之一對於 Qt.NoPen , Qt.SolidLine , Qt.DashLine , Qt.DotLine , Qt.DashDotLine ,或 Qt.DashDotDotLine 。使用 Qt.CustomDashLine QML API 不支持。默認情況下,樣式為 Qt.SolidLine。
另請參閱 Qt::PenStyle .
|
width : real |
綫的寬度。默認情況下,寬度為 2.0。