用於 NASDAQ-100 的可配置庫存圖錶。
The
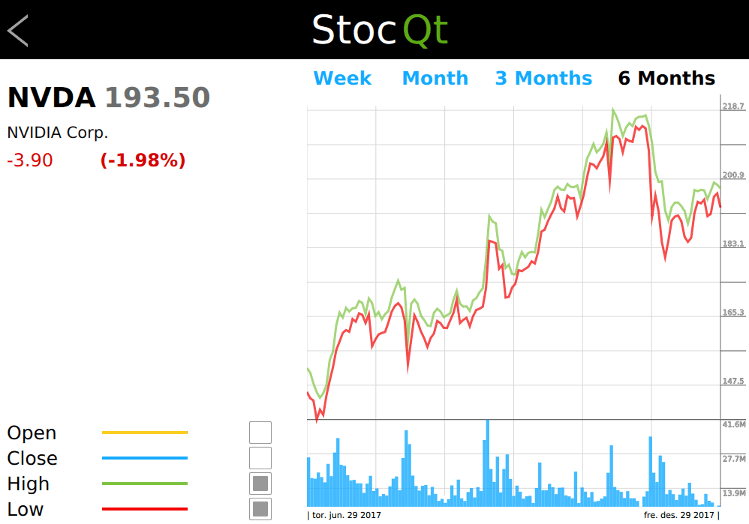
StocQt
應用程序用於呈現納斯達剋 100 股票列錶中第一隻股票的趨勢圖錶。它允許用戶從列錶選取另一隻股票,並從離綫數據集抓取所需數據使用
XMLHttpRequest
.
應用程序使用幾種自定義類型,譬如:按鈕、 CheckBox , StockChart, StockInfo, StockView, and so on. These types are used to present the stock data in a readable form and also let the user customize the trend chart. For example, the user can choose to view the weekly, monthly, quarterly, or half yearly trends in the stock price.
應用程序使用 ObjectModel 類型以訪問它依賴的 2 可視數據模型。
        ListView {
            id: root
        ...
            model: ObjectModel {
                StockListView {
                    id: listView
                    width: root.width
                    height: root.height
                }
                StockView {
                    id: stockView
                    width: root.width
                    height: root.height
                    stocklist: listView
                    stock: stock
                }
            }
        }
The StockListView model is a static data model listing the NASDAQ-100 stocks with basic information such as stockId, name, value, change, and so on. This data model is used by the application if the user wants to choose another stock from the list.
StockView is a complex data model that presents a trend chart for the selected stock. It uses another custom type, StockChart, which presents the graphical trend of the stock price using a Canvas. This data model is used for most of the time during the lifetime of the application.
Rectangle {
    id: chart
    ...
        Canvas {
            id: canvas
        ...
            onPaint: {
                numPoints = stockModel.indexOf(chart.startDate);
                if (chart.gridSize == 0)
                    chart.gridSize = numPoints
                var ctx = canvas.getContext("2d");
                ctx.globalCompositeOperation = "source-over";
                ctx.lineWidth = 1;
                drawBackground(ctx);
                if (!stockModel.ready) {
                    drawError(ctx, "No data available.");
                    return;
                }
                var highestPrice = 0;
                var highestVolume = 0;
                var lowestPrice = -1;
                var points = [];
                for (var i = numPoints, j = 0; i >= 0 ; i -= pixelSkip, j += pixelSkip) {
                    var price = stockModel.get(i);
                    if (parseFloat(highestPrice) < parseFloat(price.high))
                        highestPrice = price.high;
                    if (parseInt(highestVolume, 10) < parseInt(price.volume, 10))
                        highestVolume = price.volume;
                    if (lowestPrice < 0 || parseFloat(lowestPrice) > parseFloat(price.low))
                        lowestPrice = price.low;
                    points.push({
                                    x: j * xGridStep,
                                    open: price.open,
                                    close: price.close,
                                    high: price.high,
                                    low: price.low,
                                    volume: price.volume
                                });
                }
                if (settings.drawHighPrice)
                    drawPrice(ctx, 0, numPoints, settings.highColor, "high", points, highestPrice, lowestPrice);
                if (settings.drawLowPrice)
                    drawPrice(ctx, 0, numPoints, settings.lowColor, "low", points, highestPrice, lowestPrice);
                if (settings.drawOpenPrice)
                    drawPrice(ctx, 0, numPoints,settings.openColor, "open", points, highestPrice, lowestPrice);
                if (settings.drawClosePrice)
                    drawPrice(ctx, 0, numPoints, settings.closeColor, "close", points, highestPrice, lowestPrice);
                drawVolume(ctx, 0, numPoints, settings.volumeColor, "volume", points, highestVolume);
                drawScales(ctx, highestPrice, lowestPrice, highestVolume);
            }
        }
        Text {
            id: fromDate
            color: "#000000"
            font.family: Settings.fontFamily
            font.pointSize: 8
            Layout.alignment: Qt.AlignLeft
            text: "| " + startDate.toDateString()
        }
        Text {
            id: toDate
            color: "#000000"
            font.family: Settings.fontFamily
            font.pointSize: 8
            Layout.alignment: Qt.AlignRight
            Layout.rightMargin: canvas.tickMargin
            Layout.columnSpan: 5
            text: endDate.toDateString() + " |"
        }
    }
}
為更好地理解應用程序,使用 Qt Creator 瀏覽其代碼。
要運行範例從 Qt Creator ,打開 歡迎 模式,然後選擇範例從 範例 。更多信息,拜訪 構建和運行範例 .
文件:
圖像:
另請參閱 QML 應用程序 .